728x90
- node-exporter는 prometheus에서 공식으로 제공하는 시스템 메트릭 수집기이며, prometheus 서버의 리소스를 모니터링하기 위해서는 다운로드 및 연동 작업이 필요하다.
- node-exporter 다운로드
wget https://github.com/prometheus/node_exporter/releases/download/v1.7.0/node_exporter-1.7.0.linux-amd64.tar.gz
- tar 압축 해제
tar xzvf node_exporter-1.7.0.linux-amd64.tar.gz
- node-exporter 실행
cd node_exporter-1.7.0.linux-amd64

./node_exporter &   //백그라운드 실행
- node_exporter 서비스 등록
vi /etc/systemd/system/node_exporter.service

[Unit]
Description=Node Exporter
Wants=network-online.target
After=network-online.target

[Service]
User=root
Group=root
Type=simple
ExecStart=/root/install/node_exporter-1.7.0.linux-amd64/node_exporter    //node_exporter 실행 파일 경로

[Install]
WantedBy=multi-user.target
- node-exporter 서비스 확인
systemctl start node_exporter.service    //서비스 시작
systemctl status node_exporter.service   //서비스 상태 확인
systemctl enable node_exporter.service   //서비스 자동 실행
- node-exporter 접속 테스트
→ 이때 리눅스 서버와 로컬 윈도우 pc 사이의 방화벽 확인 (포트개방) 필요

- node-exporter metrics 확인

- prometheus 서비스 conf 수정
vi /etc/systemd/system/prometheus.service


[Unit]
Description=Prometheus Server
Documentation=https://prometheus.io/docs/introduction/overview/
After=network-online.target

[Service]
User=root
Restart=always
RestartSec=60
ExecStart=/root/install/prometheus-2.50.1.linux-amd64/prometheus \                //prometheus 실행 경로
 --config.file=/root/install/prometheus-2.50.1.linux-amd64/prometheus.yml \       //prometheus config 경로
 --storage.tsdb.path=/root/install/prometheus-2.50.1.linux-amd64/data             //prometheus tsdb 경로

[Install]
WantedBy=multi-user.target
- prometheus.yml 수정
vi prometheus.yml

# my global config
global:
  scrape_interval: 15s # Set the scrape interval to every 15 seconds. Default is every 1 minute.
  evaluation_interval: 15s # Evaluate rules every 15 seconds. The default is every 1 minute.
  # scrape_timeout is set to the global default (10s).

# Alertmanager configuration
alerting:
  alertmanagers:
    - static_configs:
        - targets:
          # - alertmanager:9093

# Load rules once and periodically evaluate them according to the global 'evaluation_interval'.
rule_files:
  # - "first_rules.yml"
  # - "second_rules.yml"

# A scrape configuration containing exactly one endpoint to scrape:
# Here it's Prometheus itself.
scrape_configs:
  # The job name is added as a label `job=<job_name>` to any timeseries scraped from this config.
  - job_name: 'prometheus'

    # metrics_path defaults to '/metrics'
    # scheme defaults to 'http'
    static_configs:
      - targets: ['192.168.59.134:9090']   //prometheus 서버

  - job_name: 'node-exporter1'
    static_configs:
      - targets: ['192.168.59.134:9100']   //node-exporter1

  - job_name: 'node-exporter2'
    static_configs:
      - targets: ['192.168.59.135:9100']   //node-exporter2

  - job_name: 'node-exporter3'
    static_configs:
      - targets: ['192.168.59.136:9100']   //node-exporter3
- 수정사항 반영을 위한 prometheus 재기동
systemctl daemon-reload      //서비스 설정 반영
systemctl start prometheus.service
systemctl status prometheus.service
- 연동 후 prometheus 서버 접속, 테스트
→ Status - targets 확인

- node-exporter를 통해 scraping한 데이터를 가져와 화면에 출력
node_memory_inactive_bytes //해당 노드의 비활성화 메모리 바이트 수(예시)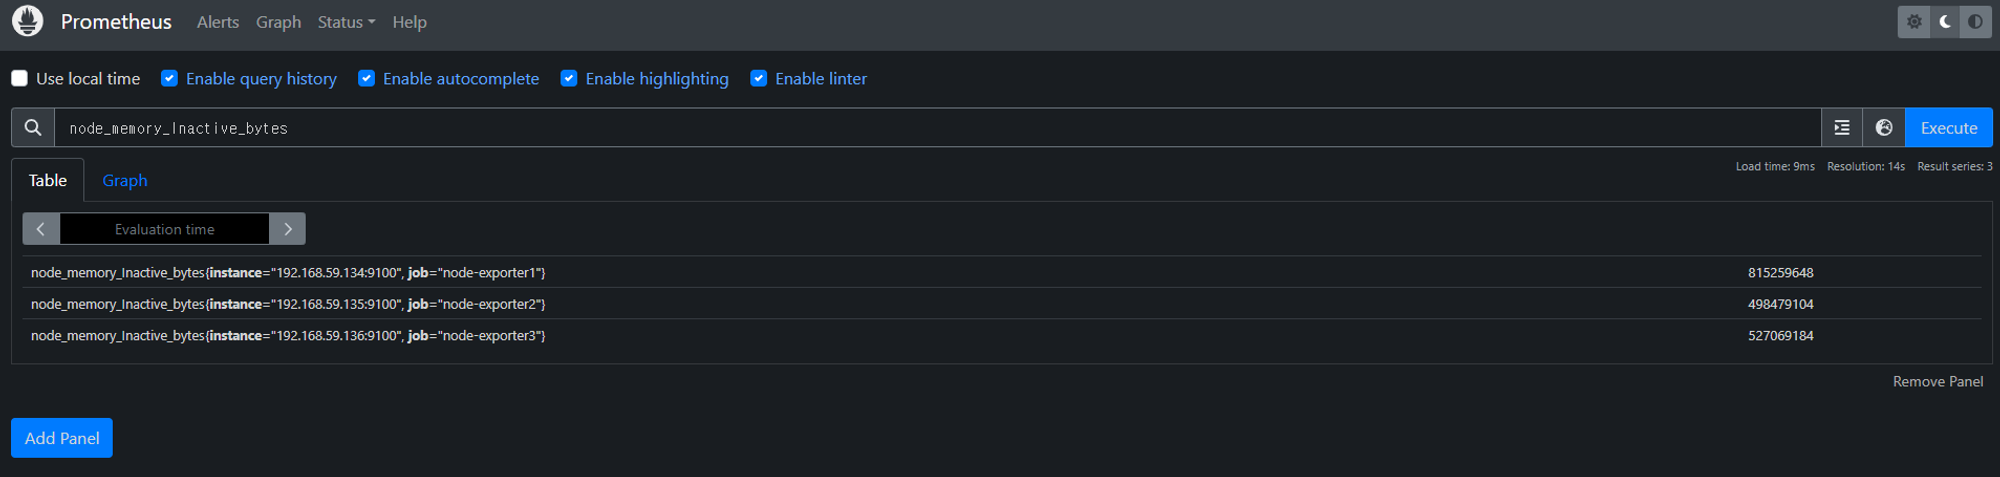

- grafana 대쉬보드에서 모니터링하기

728x90
'Prometheus' 카테고리의 다른 글
| [Prometheus] Redis_exporter 연동 (Linux) (2) | 2024.08.26 |
|---|---|
| [Prometheus] mysqld_exporter 연동 (Linux) (0) | 2024.08.26 |
| Prometheus? (0) | 2024.08.26 |